
Displaying HELOC Rates With Confidence: Accuracy, Fees, and Compliance Built In

Key takeaways: 

  • A lot of lending institutions have steered clear of showcasing HELOC rates because of concerns about compliance and misrepresentation. 
  • Displaying HELOC rates gives lending institutions a way to generate more equity-backed originations. 
  • We developed a HELOC rate comparison table that builds in required disclosures, fee transparency, and other key features. 
  • The HELOC rate table connects directly to your pricing engine to provide live rates to potential borrowers directly from your website.

We’re in an age where most people expect instant gratification. Amazon offers same-day delivery. Streaming services make entire seasons available overnight. And financial institutions offer near-instant rate quotes for a lot of their products. 

Home equity lines of credit (HELOCs) are a rare exception to that rule. Many lending teams have viewed HELOC rate display as too difficult. Accuracy and compliance concerns mean they keep rates hidden from consumers.

That’s had a direct impact on homeowners. About 30% can’t even correctly identify a HELOC. This isn’t just hurting those homeowners, either. It’s also hurting lending institutions who could be capitalizing on the major opportunity that lies in HELOC origination. 

The push-pull around HELOC rates

The modern American expects live rate comparison tables, à la NerdWallet and Bankrate. In their minds, visibility into rates means transparency from the financial institution. They don’t want to be in the dark, and a lack of rate data can cause them to feel shut out. 

Still, a lot of lenders have been slow to deploy HELOC rate comparison tables. They fear the legal and reputational difficulties that could come with misquoting a rate. 

Interestingly, those same fears don’t seem to surface for mortgage rate tables anymore. Lenders trust the tools they use to provide rate transparency for purchase loan products. 

So what makes HELOCs different? We think it comes from a deficit of the right tools. And that’s why we launched the BankingBridge HELOC rate comparison table.

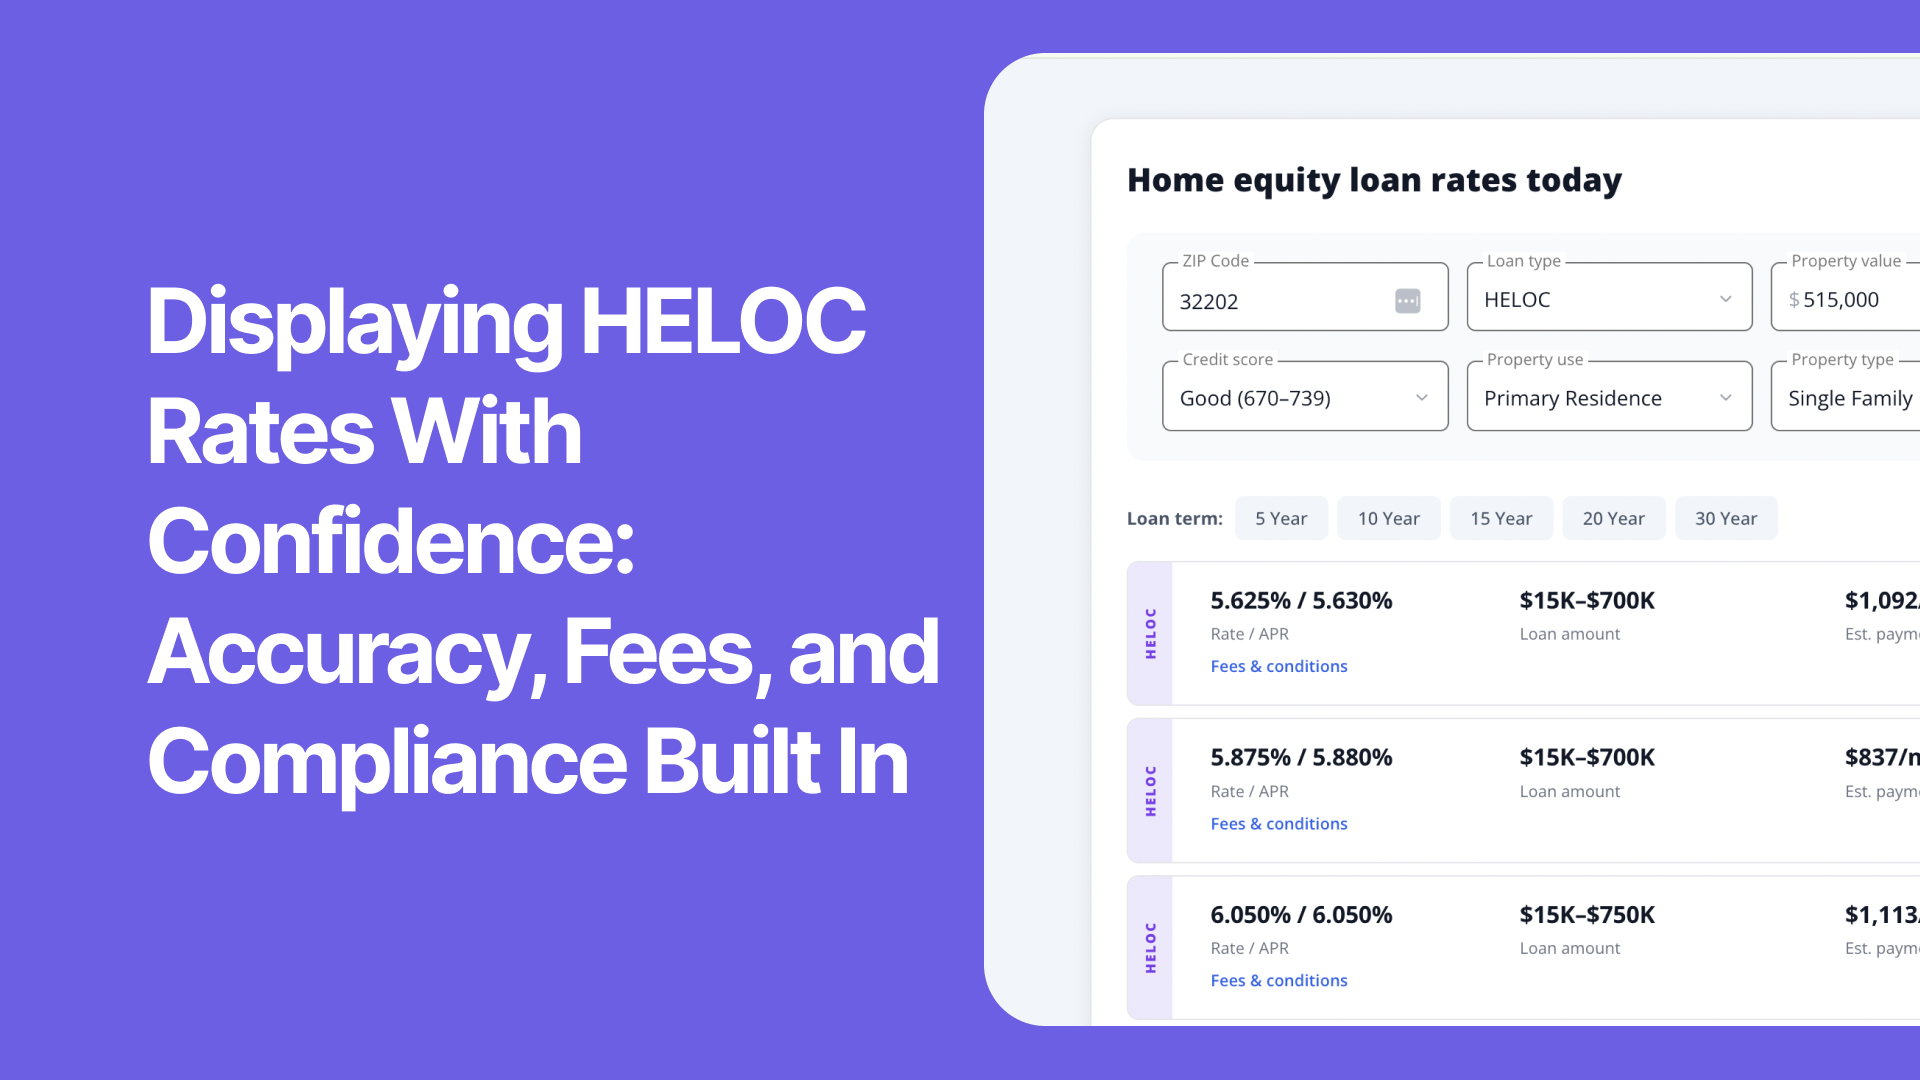
The new HELOC rate comparison table gives you all the control, flexibility, and ease of use you expect from mortgage rate tables. 

It connects directly to your pricing engine (e.g., Optimal Blue, Polly, Mortech, Lender Price, Loansifter). That allows it to provide real-time rate data to consumers based on the parameters they set, like their credit score and the amount they want to borrow. 

The rates display on your website via a widget that we customize to match your company’s branding.

"But what about accuracy and disclosures?" 

Maybe you’ve considered a HELOC table in the past, but decided against it because of compliance or misrepresentation concerns. We understand. We built this rate table to mitigate those issues. 

To protect your lending institution, the HELOC rate comparison table includes a few key features:

  • Pricing engine-backed accuracy: The rate table integrates directly with your pricing engine so it can continually pull the latest HELOC rate data. In short, it gives you a way to reliably display the same rate information that your loan officers access. 
  • Timestamps: The automated feed from your pricing engine shows “rates as of” stamps. This way, the consumer stays informed about what’s actually available. And you protect your company from a regulatory compliance perspective. 
  • Side-by-side APRs and rates: Too many borrowers don’t understand the difference between interest rates and annual percentage rates. By showcasing both, the HELOC rate table eliminates a potential hurdle for your loan officers. 
  • Built-in disclosures: We designed the HELOC rate comparison table to be thoughtfully compliant with TILA and Regulation Z. Features like the end date for promotional periods and the variable rate index are included in the table’s footnotes. 
  • Transparent fees: The rate table includes a clickable line item for fees and conditions. Keeping all of this at the lead’s fingertips means they get the information they want. And you get a hedge of protection around your company. With clarity about what the HELOC entails, you act as the truthful lender that people and regulatory authorities expect.  
  • Localization: Our HELOC rate table allows you to overlay location-specific logic, like caps and product variants specific to your state.

Not just a repurposed mortgage table

When we developed this HELOC rate comparison table, we didn’t just reformat our existing mortgage rate table. Instead, we sat down to create a rate display tool that specifically factors in the variable-rate complexity that comes with home equity lines of credit. 

The goal was to deliver a comparison table that’s an asset, not a liability. 

It can help you stand out from the competition: the vast sea of lending teams that don’t showcase HELOC rates. At the same time, it minimizes the headaches that arise when you only show a promotional rate (“Rates as low as…”). Your loan officers won’t have to field frustrations because offered rates aren’t as low as what people saw online. 

Get the confidence you need to display HELOC rates

The BankingBridge HELOC rate comparison table gives you configuration options and control. We built that in to deliver a rate table that gives you confidence and fills your pipeline. 

To help the rate table function well, we recommend a few best practices. First, assign two ownership groups. The first one works directly with our team to connect the HELOC rate table to your pricing engine and configure how it displays on your website. The second group should be responsible for any leads that come through the rate table. 

It often benefits these two teams to have a periodic sync (e.g., quarterly). That way, the configuration team can talk with the sales team. What’s working? What are leads asking for? Where can you make adjustments with your HELOC rate display to drive more closed lines of credit? Are there any new legal or compliance issues to consider? 

We can help with all of this. To explore the HELOC rate comparison table for yourself, book a demo with our team. We’ll show you the built-in compliance features, the way it connects to your pricing engine, and how the experience displays to leads. This way, you build more transparency into your equity-backed products, supporting higher conversion rates. 

If you’re ready to deploy a HELOC rate table with confidence, schedule some time with us today.
Turn your website traffic into mortage leads

Book a demo

The 2024 Mortgage Lead Conversion Mastery Playbook

Strategies and Insights from Converting Over 250,000 Mortgage Leads

Get the scoop on what’s new

Subscribe to our newsletter to stay up to date on latest trends, tips& tricks, industry news & events in the mortgage industry

Thank you! Your submission has been received!
Oops! Something went wrong while submitting the form.

100+ mortgage companies are increasing their revenue using BankingBridge products

Business
Apr 12, 2023

Displaying HELOC Rates With Confidence: Accuracy, Fees, and Compliance Built In

Key takeaways: 

  • A lot of lending institutions have steered clear of showcasing HELOC rates because of concerns about compliance and misrepresentation. 
  • Displaying HELOC rates gives lending institutions a way to generate more equity-backed originations. 
  • We developed a HELOC rate comparison table that builds in required disclosures, fee transparency, and other key features. 
  • The HELOC rate table connects directly to your pricing engine to provide live rates to potential borrowers directly from your website.

We’re in an age where most people expect instant gratification. Amazon offers same-day delivery. Streaming services make entire seasons available overnight. And financial institutions offer near-instant rate quotes for a lot of their products. 

Home equity lines of credit (HELOCs) are a rare exception to that rule. Many lending teams have viewed HELOC rate display as too difficult. Accuracy and compliance concerns mean they keep rates hidden from consumers.

That’s had a direct impact on homeowners. About 30% can’t even correctly identify a HELOC. This isn’t just hurting those homeowners, either. It’s also hurting lending institutions who could be capitalizing on the major opportunity that lies in HELOC origination. 

The push-pull around HELOC rates

The modern American expects live rate comparison tables, à la NerdWallet and Bankrate. In their minds, visibility into rates means transparency from the financial institution. They don’t want to be in the dark, and a lack of rate data can cause them to feel shut out. 

Still, a lot of lenders have been slow to deploy HELOC rate comparison tables. They fear the legal and reputational difficulties that could come with misquoting a rate. 

Interestingly, those same fears don’t seem to surface for mortgage rate tables anymore. Lenders trust the tools they use to provide rate transparency for purchase loan products. 

So what makes HELOCs different? We think it comes from a deficit of the right tools. And that’s why we launched the BankingBridge HELOC rate comparison table.

The new HELOC rate comparison table gives you all the control, flexibility, and ease of use you expect from mortgage rate tables. 

It connects directly to your pricing engine (e.g., Optimal Blue, Polly, Mortech, Lender Price, Loansifter). That allows it to provide real-time rate data to consumers based on the parameters they set, like their credit score and the amount they want to borrow. 

The rates display on your website via a widget that we customize to match your company’s branding.

"But what about accuracy and disclosures?" 

Maybe you’ve considered a HELOC table in the past, but decided against it because of compliance or misrepresentation concerns. We understand. We built this rate table to mitigate those issues. 

To protect your lending institution, the HELOC rate comparison table includes a few key features:

  • Pricing engine-backed accuracy: The rate table integrates directly with your pricing engine so it can continually pull the latest HELOC rate data. In short, it gives you a way to reliably display the same rate information that your loan officers access. 
  • Timestamps: The automated feed from your pricing engine shows “rates as of” stamps. This way, the consumer stays informed about what’s actually available. And you protect your company from a regulatory compliance perspective. 
  • Side-by-side APRs and rates: Too many borrowers don’t understand the difference between interest rates and annual percentage rates. By showcasing both, the HELOC rate table eliminates a potential hurdle for your loan officers. 
  • Built-in disclosures: We designed the HELOC rate comparison table to be thoughtfully compliant with TILA and Regulation Z. Features like the end date for promotional periods and the variable rate index are included in the table’s footnotes. 
  • Transparent fees: The rate table includes a clickable line item for fees and conditions. Keeping all of this at the lead’s fingertips means they get the information they want. And you get a hedge of protection around your company. With clarity about what the HELOC entails, you act as the truthful lender that people and regulatory authorities expect.  
  • Localization: Our HELOC rate table allows you to overlay location-specific logic, like caps and product variants specific to your state.

Not just a repurposed mortgage table

When we developed this HELOC rate comparison table, we didn’t just reformat our existing mortgage rate table. Instead, we sat down to create a rate display tool that specifically factors in the variable-rate complexity that comes with home equity lines of credit. 

The goal was to deliver a comparison table that’s an asset, not a liability. 

It can help you stand out from the competition: the vast sea of lending teams that don’t showcase HELOC rates. At the same time, it minimizes the headaches that arise when you only show a promotional rate (“Rates as low as…”). Your loan officers won’t have to field frustrations because offered rates aren’t as low as what people saw online. 

Get the confidence you need to display HELOC rates

The BankingBridge HELOC rate comparison table gives you configuration options and control. We built that in to deliver a rate table that gives you confidence and fills your pipeline. 

To help the rate table function well, we recommend a few best practices. First, assign two ownership groups. The first one works directly with our team to connect the HELOC rate table to your pricing engine and configure how it displays on your website. The second group should be responsible for any leads that come through the rate table. 

It often benefits these two teams to have a periodic sync (e.g., quarterly). That way, the configuration team can talk with the sales team. What’s working? What are leads asking for? Where can you make adjustments with your HELOC rate display to drive more closed lines of credit? Are there any new legal or compliance issues to consider? 

We can help with all of this. To explore the HELOC rate comparison table for yourself, book a demo with our team. We’ll show you the built-in compliance features, the way it connects to your pricing engine, and how the experience displays to leads. This way, you build more transparency into your equity-backed products, supporting higher conversion rates. 

If you’re ready to deploy a HELOC rate table with confidence, schedule some time with us today.
Continue reading

Our newsletter

Get great curated articles every week.

No spam!